Visual Intelligence
Visual Intelligence & Professional Presentation
Having mastered automation and daily chronicles in Part 3, you are now ready to transform your systematic foundation with visual intelligence and professional presentation. This is Part 4 of our comprehensive series:
Chapter VIII: The Web of Deduction
Visualizing Connections: The Mind Made Visible
“Behold, Watson—the web of our investigation made visible!” Holmes gestured dramatically toward his laptop screen, where a chaotic tangle of dots and lines resembled nothing so much as a spider web designed by a madman.
Watson peered at the display with obvious confusion. “Holmes, this resembles your filing system from Chapter I—chaotic and utterly unhelpful.”
Holmes raised an eyebrow with characteristic disdain. “Precisely why we shall remedy this immediately. The Graph view in its raw state is like London without street signs—all the connections exist, but navigation becomes impossible.”
The human brain, Watson, naturally thinks in networks and associations. Traditional filing systems force us to think hierarchically—everything must go in one folder or another. But real knowledge doesn’t work that way. A single person might be a suspect in one case, a witness in another, and a client in a third.
Graph view reveals these multi-dimensional relationships visually. When properly configured, it becomes a thinking aid that shows patterns invisible to linear analysis.
Configuring Graph View for Intelligence
How do I open and set up Graph View?
“First, Watson, we must eliminate the administrative clutter that obscures meaningful connections.”
How do I exclude unnecessary files from the graph?


Color-Coding for Clarity
“Now, Watson, we shall apply the fundamental principle of visual organization—systematic color coding that instantly communicates meaning.”
How do I configure Graph Groups with colors?

Reading the Network
“Now observe, Watson, how clarity emerges from chaos!”
- Red Nodes: Active cases and investigations
- Orange Nodes: People, concepts, and assets
- Green Nodes: Timeline entries and meetings
- Connecting Lines: Relationships and mentions between notes
“Notice how Mr. Pumpernickel connects to our case, how our meetings link to our investigation, how personnel connect across multiple cases. This is deduction made visible—the pattern of connections that reveals the truth!”
How do I interact with the graph for analysis?

Local Graph View for Focused Analysis
“For detailed investigation of specific cases, Watson, we require focused visualization that eliminates distracting information.”
How do I activate and use Local Graph?

- Context Focus: Shows only connections relevant to the current note
- Reduced Clutter: Eliminates unrelated information that confuses analysis
- Dynamic Updates: Changes automatically as you navigate between different notes
- Investigation Mapping: Perfect for visualizing the scope of individual cases
Chapter IX: The Aesthetic of Excellence
Professional Appearance for Superior Minds
“Watson,” Holmes announced with the solemnity of a man addressing matters of profound importance, “a disorganized appearance reflects a disorganized mind. Our digital Baker Street must inspire confidence in our clients and efficiency in our methods.”
“Visual excellence is not vanity, Watson—it is professional necessity. When clients see systematic organization and polished presentation, they trust our analytical capabilities. When we ourselves work in an environment of visual clarity, our thinking becomes more precise.”
“Consider the difference between working in a cluttered, chaotic space versus a clean, organized environment. The visual system influences the cognitive system, Watson. Clear visuals promote clear thinking, systematic organization encourages systematic analysis.”
Installing Professional Themes
How do I install and activate a professional theme?

Icon Management for Visual Clarity
How do I install and configure the Iconize plugin?

Color-Coded Organization
How do I install and configure File Color plugin?

How do I apply colors systematically?

Enhanced Documentation with Advanced Callouts
“Beyond basic callouts, Watson, we shall master the advanced formatting that distinguishes professional documentation from amateur notes.”
In your Vanishing Venture Capital Note, under the Investigation Log section, paste the following:
 > [!warning]+ Suspicious Behavior Alert
 > **Subject**: Reginald Pumpernickel
 > **Observation**: Client displayed excessive anger during interview
 > **Assessment**: Performance suggests deception rather than genuine distress
 > **Recommended Action**: Verify claims through independent sources

 > [!info]- Case Background (Collapsible)
 > Initial investment of £500,000 made three weeks ago
 > Company records completely disappeared
 > Similar pattern noted in previous cases

 > [!quote] Direct Testimony
 > "I trusted them completely with my life savings. Now everything has vanished without a trace."
 > — Reginald Pumpernickel, Client Interview, 2025-09-22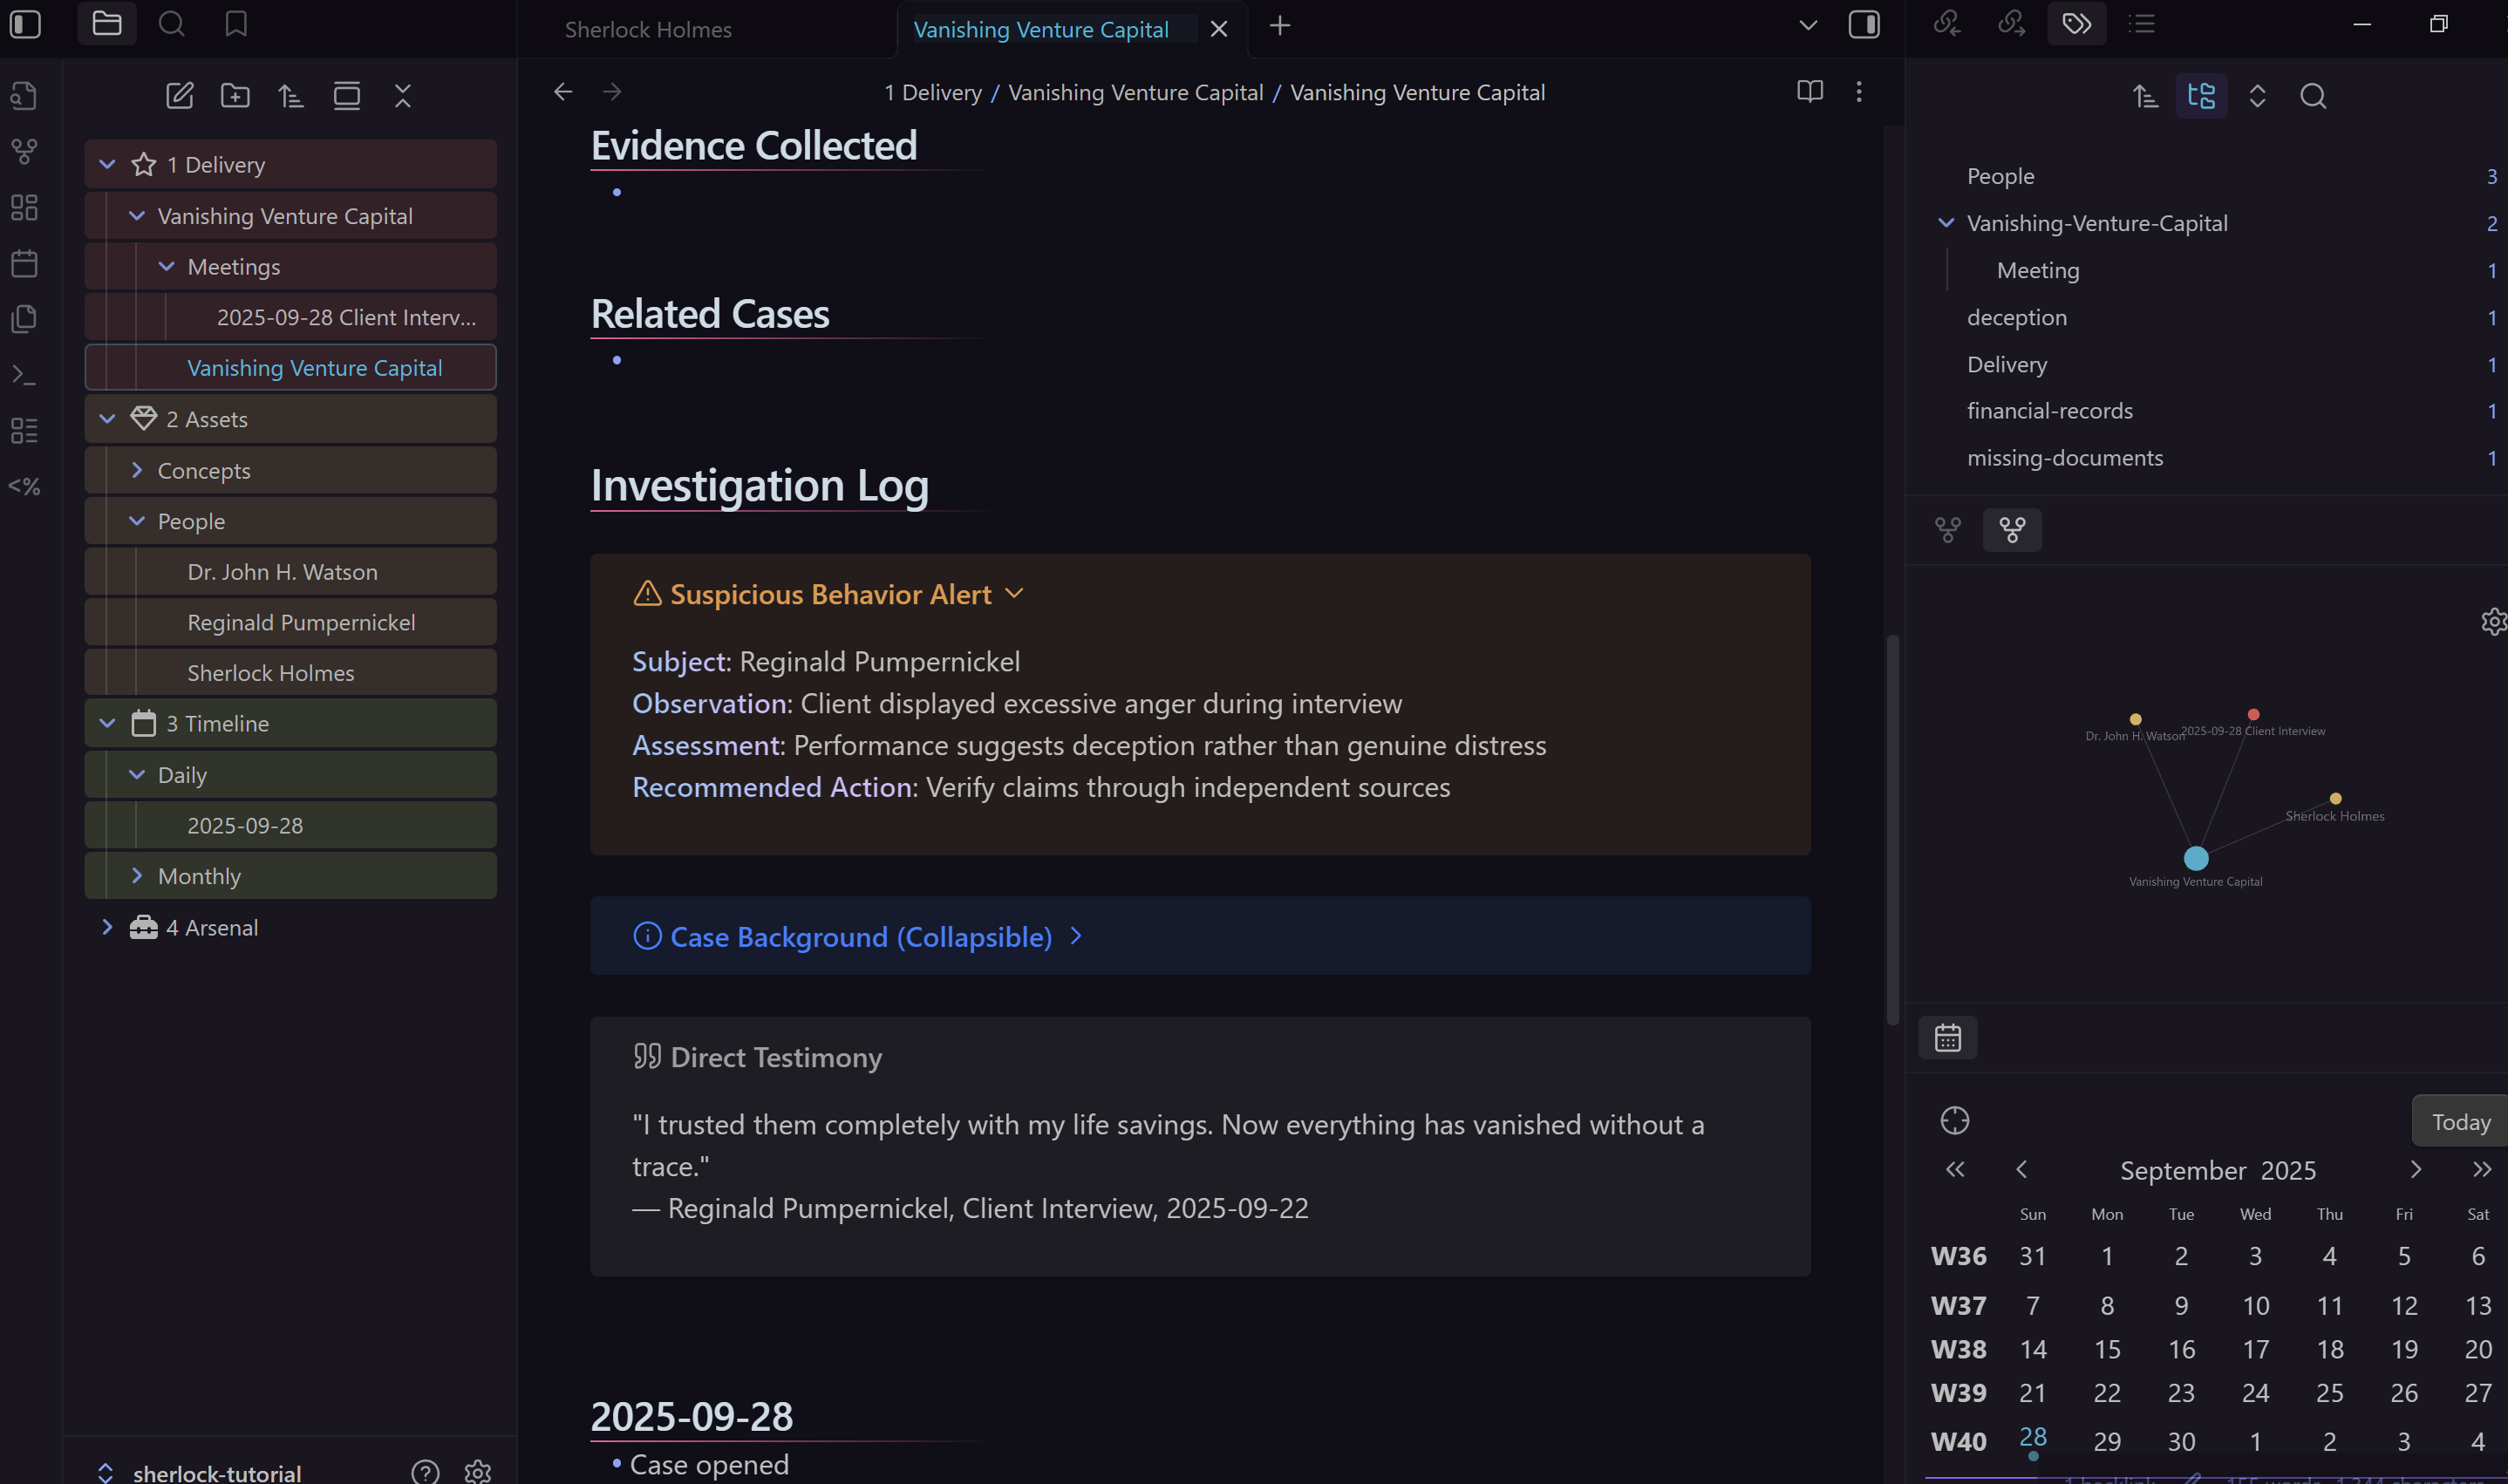
+Symbol: Makes callouts expanded by default-Symbol: Makes callouts collapsible/foldable- Bold Formatting: Creates structured information hierarchy
“Notice, Watson, how our systematic visual approach transforms raw information into authoritative professional presentation. This is the difference between amateur note-taking and professional investigation services.”
Visual Intelligence Mastery Achieved
The Transformation Complete
“Watson,” Holmes concluded with evident satisfaction, “we have now transformed our systematic foundation into a professional investigation system that operates with both analytical precision and visual authority.”
- Visual Intelligence: Graph view mastery that reveals hidden patterns and connections
- Professional Presentation: Enhanced formatting and visual organization worthy of client presentation
- Systematic Visual Design: Color coding and iconography that creates instant understanding
- Advanced Documentation: Professional callouts and typography that convey expertise
- Integrated Workflow: Visual tools that enhance rather than distract from analytical work
“Consider the evolution, Watson:
- From chaotic connections to organized visual intelligence
- From amateur formatting to professional presentation standards
- From basic notes to comprehensive investigation reports
- From scattered information to systematic visual communication”
“Every client now sees not just organized information, but professional competence. Every case benefits from visual analysis that reveals patterns invisible to linear thinking. Every investigation presents findings with authority and clarity.”
“These visual intelligence and presentation techniques create the polished foundation upon which we shall build dynamic intelligence networks. Our graph views reveal connections, our professional formatting conveys authority, and our systematic visual design enables sophisticated analysis.”
Next Steps:
“In Part 5, we shall create dynamic intelligence networks and adaptive databases that automatically organize and reveal patterns in your growing knowledge base.”
“The game, as they say, is afoot—and we are now equipped with visual intelligence and professional presentation capabilities that match our analytical excellence.”